Prediction is when researchers predict an event or a situation using a scientific model.
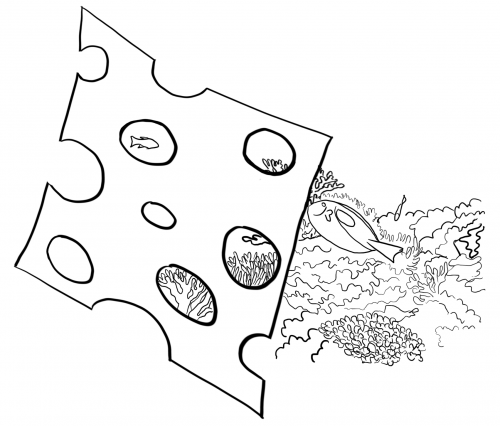
Fitting a model is a bit like looking at the world through a piece of Swiss cheese because it’s based on the data you do have – these are the holes in the cheese. However, we can then use the model to predict what is happening in areas or at times where we don’t have data – the areas hidden behind the cheese.
Predictions are essentially an evidence-based guess, using the data we have, about what might happen in a situation where we don’t have data.
Scientists need to verify how accurate the model predictions are and one way to do that is to compare them to observational data. They do this by holding back some data and then using the models to make predictions at those places or times. The differences in the model predictions and the observations help researchers improve the models.
For more general information about scientific predictions follow this link
https://theconversation.com/peering-into-the-future-does-science-require-predictions-66494
Uncertainty in prediction
In the Virtual Reef Diver project, we use the data from observations to make a model of coral cover. The model is based on the combination of multiple data sets, with data available for many different locations and sometimes multiple years.
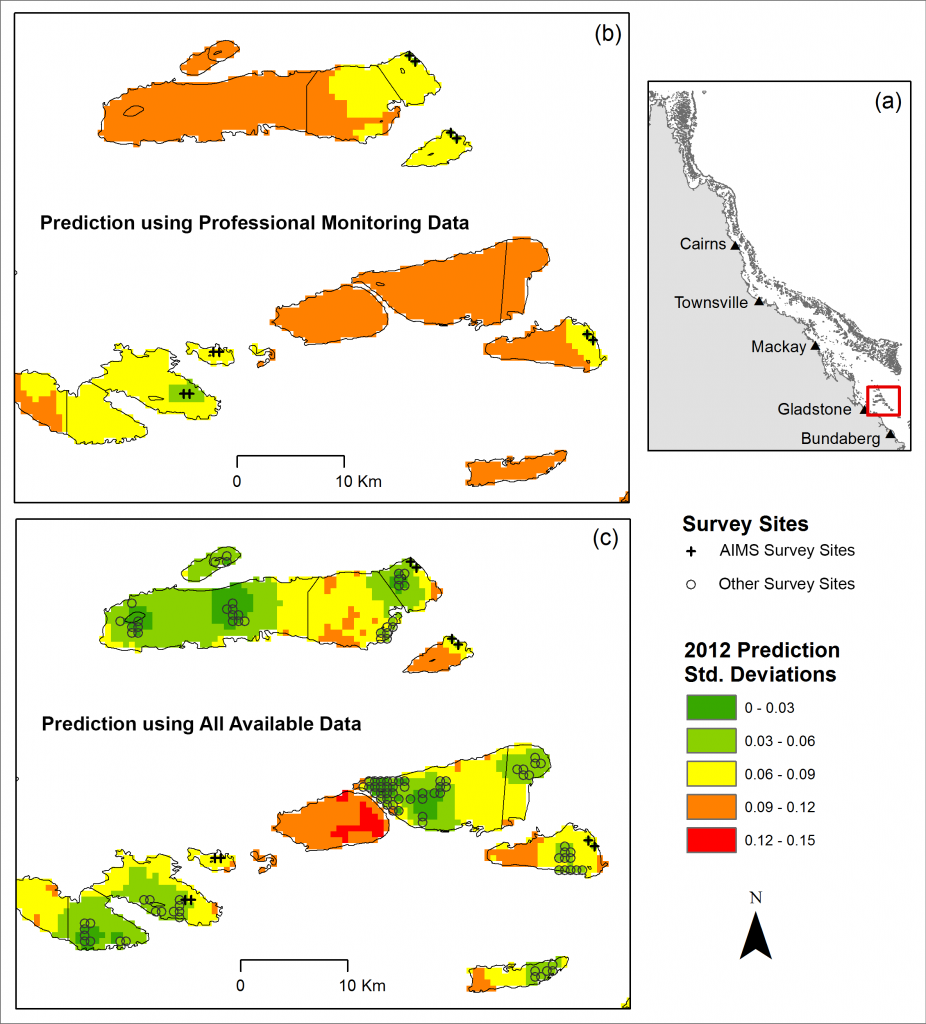
When we make predictions we also generate “uncertainty” values for each prediction. The uncertainty value is essentially an acknowledgement that our model predictions aren’t perfect in areas or at times where we haven’t observed data.
With more data, prediction accuracy generally increases and uncertainty goes down gå til denne hjemmeside. As the model shown here incorporates more data, there are more areas with lower standard deviations, meaning lower uncertainty in the predictions in those areas.
Maps of predicted coral cover are useful to Great Barrier Reef managers who need to understand where coral is increasing or decreasing. However, maps of prediction uncertainty are also very useful too. First of all, maps of prediction uncertainty help managers understand where they can be most, or least, confident in the predictions. This can help managers identify areas where additional data are needed (areas where uncertainty are very high). The maps of predictions and uncertainty can also be shared between all of the organisations currently monitoring the Great Barrier Reef, so that sampling and collection of observations across the expanse of the reef can be better coordinated.
